Surreal illustration of lungs intertwined with air pollution particles and a map of Turkey, representing the connection between air quality and respiratory health.

Unveiling the Link Between Air Quality and Tuberculosis: What You Need to Know

"A deep dive into a recent study exploring the correlation between air pollution and TB incidence in Turkey, and what it means for respiratory health."


Tuberculosis (TB) remains a significant public health challenge globally, with regional disparities highlighting the complex interplay of factors that influence its spread. While socioeconomic conditions and access to healthcare are well-established determinants, the role of environmental factors, such as air pollution, has garnered increasing attention. The premise is simple: poor air quality, laden with particulate matter and other pollutants, may weaken respiratory defenses and make individuals more susceptible to TB infection.

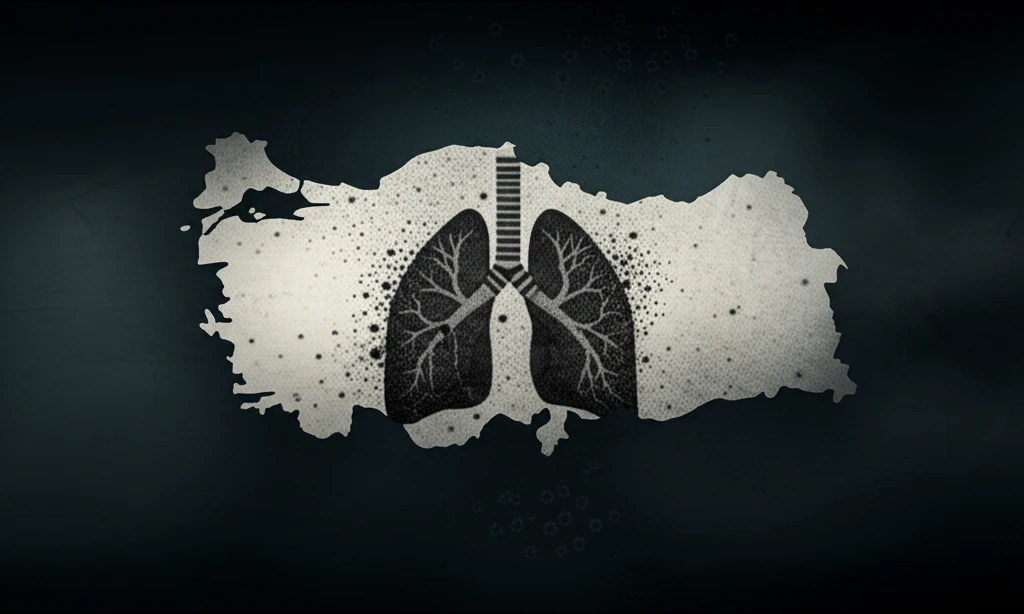
To investigate this potential link, a study was conducted in Turkey, a country with a diverse geographical landscape and varying levels of air pollution. The researchers aimed to evaluate the relationship between ambient air quality, specifically particulate matter (PM10) concentrations, and the incidence of TB across different regions of Turkey during 2010 and 2011. By employing geographical information system (GIS) technology, they sought to visualize and analyze the spatial distribution of TB cases in relation to air pollution levels.

This article delves into the findings of this study, exploring the methodology used, the results obtained, and the implications for understanding the complex relationship between air quality and respiratory health. While the study's conclusions may challenge some preconceived notions, they underscore the importance of considering a multitude of factors when addressing the TB epidemic and protecting public health.

Decoding the Turkish Air Quality and TB Study: Methodology and Findings

Surreal illustration of lungs intertwined with air pollution particles and a map of Turkey, representing the connection between air quality and respiratory health.

The study utilized an ecological design, drawing upon existing datasets to analyze the correlation between TB incidence and air quality. Tuberculosis data for 2010 and 2011 were obtained from the "Tuberculosis Fight in Turkey, 2014 Report." Air quality data, specifically mean concentrations of PM10, were sourced from the Turkish Statistical Institute. These PM10 concentrations represented averages collected between December 1, 2009, and November 30, 2010.

Researchers used ArcMap 10.4, a geographic information system (GIS) software, to visualize and analyze the spatial distribution of TB cases and air pollution levels. Areal interpolation, a technique used to estimate values over a continuous surface based on discrete data points, was employed to create a smooth representation of TB incidence across the country. Statistical analyses, including the Friedman test and correlation analysis, were conducted to examine potential relationships between PM10 levels and TB incidence and prevalence.

  • Data on air pollutants were gathered from 113 monitoring stations spread across 81 provinces in Turkey, with an average of 319.5 days of data collection per station in 2010.
  • The average PM10 level recorded was 67.2 µg/m3, with the highest concentrations observed during the winter months (79.3 µg/m3). Statistical analysis revealed significant seasonal variations in PM10 levels (p<0.001).
  • Based on the US Environmental Protection Agency (EPA) Air Quality Index, air quality was classified as "good" in 26 stations, "moderate" in 78 stations, and "unhealthy for sensitive groups" in 9 stations.
  • Areal interpolation of TB cases revealed a high-risk zone concentrated in the Black Sea, Marmara, and Northern Aegean regions, corresponding to the northern and western parts of Turkey.
  • Surprisingly, the study found poor negative correlations between PM10 levels and both TB incidence rate (r= -0.268, p<0.05) and TB prevalence (r= -0.276, p<0.05). This suggests that higher PM10 levels were associated with slightly lower TB rates, a counterintuitive finding.
The study's most striking finding was the poor negative correlation between PM10 levels and TB incidence and prevalence. This contradicts the expectation that higher air pollution would lead to a greater incidence of TB. The researchers interpret this result cautiously, suggesting that air pollution, as measured by PM10 levels, may not be a primary driver of TB epidemiology in Turkey. However, they acknowledge that seasonal variations in air pollution could still pose a risk to respiratory health, even if they don't directly translate into increased TB rates.

Key Takeaways and Future Directions

While this study provides valuable insights into the relationship between air quality and TB in Turkey, it's important to consider its limitations. As an ecological study, it can only establish correlations at the population level, not causation at the individual level. Furthermore, the study only considered PM10 levels as a measure of air quality, while other pollutants may also play a role. More research is needed to explore the complex interplay of environmental, socioeconomic, and individual factors that contribute to the TB epidemic. Future studies could benefit from longitudinal designs, individual-level data, and a broader range of air pollution metrics to gain a more comprehensive understanding of the relationship between air quality and respiratory health.

About this Article -

This article was crafted using a human-AI hybrid and collaborative approach. AI assisted our team with initial drafting, research insights, identifying key questions, and image generation. Our human editors guided topic selection, defined the angle, structured the content, ensured factual accuracy and relevance, refined the tone, and conducted thorough editing to deliver helpful, high-quality information.See our About page for more information.

Everything You Need To Know

1

How did the researchers conduct the study on air quality and Tuberculosis in Turkey?

The study was designed as an ecological study, which means it looked at data at a population level rather than tracking individuals. Researchers used Tuberculosis data for 2010 and 2011 that was obtained from the "Tuberculosis Fight in Turkey, 2014 Report." The air quality data, specifically mean concentrations of PM10, came from the Turkish Statistical Institute. They also used ArcMap 10.4 geographic information system (GIS) software to map and analyze the locations of TB cases and pollution levels. Areal interpolation was used to estimate TB incidence across the country. They then used the Friedman test and correlation analysis to look for relationships between PM10 levels and TB.

2

What were the main findings of the study, and were there any surprises in the results?

The study surprisingly found a poor negative correlation between PM10 levels and both Tuberculosis incidence and prevalence. This means that areas with higher levels of PM10 actually had slightly lower rates of TB, which goes against what was expected. It's important to note that the study only looked at PM10 levels and other pollutants may have an impact. The researchers suggest that PM10 levels might not be the main factor influencing TB rates in Turkey.

3

What exactly is PM10, and why is it an important factor in this study?

PM10 refers to particulate matter with a diameter of 10 micrometers or less. These are inhalable particles that can penetrate deep into the lungs and cause respiratory problems. PM10 is significant because it's a common air pollutant, and high concentrations are often used as an indicator of poor air quality. The study used PM10 levels as a measure of air quality to see if there was a relationship between air pollution and Tuberculosis rates. The US Environmental Protection Agency (EPA) Air Quality Index was used to classify the level of PM10 and determine if it was good, moderate, or unhealthy.

4

What is areal interpolation, and how was it used to analyze Tuberculosis data in Turkey?

Areal interpolation is a statistical technique used to estimate the values of a variable across a continuous surface based on discrete data points. In the context of the study, areal interpolation was used to create a smooth representation of Tuberculosis incidence across Turkey. This involved taking the known TB case data from specific locations (like cities or regions) and estimating the TB incidence in areas where data was not directly available. By using areal interpolation, the researchers could visualize the spatial distribution of TB cases and identify high-risk zones across the country, even in areas with limited data.

5

What is GIS, and how was it utilized in the investigation of air quality and Tuberculosis?

GIS stands for Geographic Information System. It is a computer system for capturing, storing, analyzing, and displaying data related to positions on Earth's surface. In the study, ArcMap 10.4, a GIS software, was used to visualize and analyze the spatial distribution of Tuberculosis cases and air pollution levels across Turkey. This allowed researchers to see if there were any geographical patterns or correlations between areas with high PM10 concentrations and areas with high TB incidence. GIS is important because it enables researchers to map and analyze spatial data, which can reveal insights that might not be apparent from looking at raw data alone.

Newsletter Subscribe

Subscribe to get the latest articles and insights directly in your inbox.