
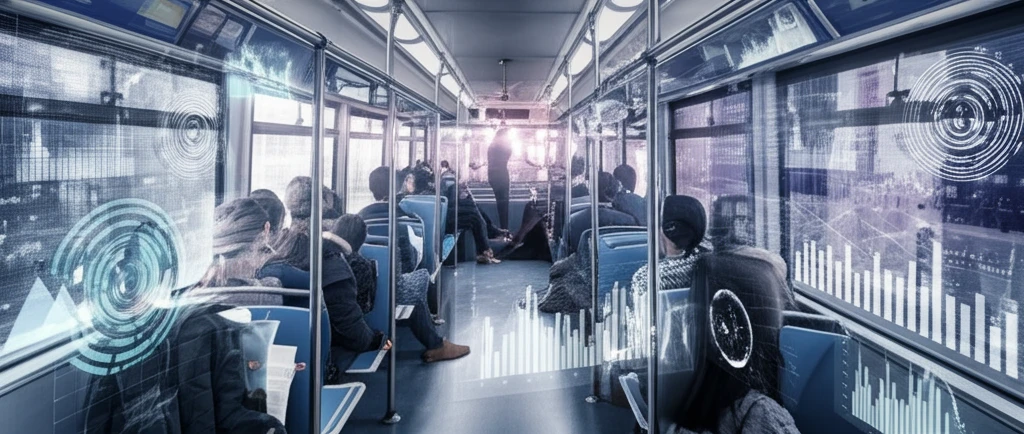
Navigating the Urban Jungle: How Data Can Ease Passenger Crowding on Buses

"Uncover strategies for leveraging data analytics to enhance the commuting experience and improve urban bus networks."
Imagine stepping onto a bus where you can actually find a seat, or at least not be crammed against the window like a sardine. For many city dwellers, this is a distant dream. Public transport networks, especially bus systems, are the lifelines of urban areas, but they often struggle with overcrowding. Understanding and managing passenger flow is crucial for improving the daily commute and making public transport a viable option for more people.
While passenger flow data is invaluable, it is often hard to come by. However, a recent study in Harbin, China, sheds light on how analyzing passenger-crowding characteristics can transform bus transport networks. This study delves into the details of passenger flow, identifies crowded areas, and proposes data-driven solutions to enhance the commuting experience.
The Harbin research offers insights into how cities worldwide can leverage data to optimize their bus systems, making them more efficient, comfortable, and attractive to riders. This isn't just about convenience; it's about creating sustainable, livable cities.
The Crowded Ride: Why Peak Hours Hurt Everyone
Peak-hour crowding in urban transit affects passengers' travel satisfaction and reduces operation performance for transit agencies, a pattern observed in both bus and rail systems. The consequences ripple beyond the vehicle itself, undermining the reliability that keeps commuters choosing public transport.
The Classic Toolkit and Its Limits
Depending on the root causes, transit agencies can reduce crowding by running more buses on a route or re-allocating them from another route, a direct but supply-constrained fix. Newer methods use automatic passenger counting data and two-stage load prediction models to anticipate demand, yet these approaches still depend on the accuracy and coverage of the data feeding them.
From Stops and Routes to Network Science
Research into bus transport networks has long modeled the system as a graph in which a node represents a bus stop and an edge represents the route between two stops, an approach known as L-Space modeling in complex networks. Studies of major Chinese cities, including Hangzhou, Nanjing, Beijing and Shanghai, showed that the distributions of node degree and the number of bus routes a stop joins follow distinctive patterns, providing an early analytical foundation for understanding crowding as a network phenomenon.
Decoding Passenger Crowding: Key Findings from Harbin
Researchers in Harbin undertook an extensive investigation of the city's bus transport network (BTN-H). This involved collecting data from 132 bus routes and 993 bus stations, meticulously tracking passenger flow during peak hours. The goal was to understand the patterns of passenger-crowding and identify areas where improvements could be made.
- Crowding varies significantly between different sections of bus routes.
- Certain stations act as major hubs, experiencing higher crowding levels.
- Passenger-crowding tends to concentrate in the middle sections of routes.
Predicting Loads and Counting Crowds in Real Time
Recent work has advanced two-stage methods for bus passenger load prediction built on automatic passenger counting data, aiming to forecast crowding before it happens. Complementary innovations such as AI-powered smart bus stops go beyond counting passengers, letting transit planners analyze behavioral patterns such as how often commuters decide to leave a stop.
When Data Meets Messy Reality
Crowding is not purely a technical problem: annotated bibliographies on carriage and platform crowding in the Australian railway industry treat it as a socioeconomic issue spanning rider welfare and equity. The boarding process in other crowded transit settings shows how gate design, airline processes, passenger behavior, staff coordination, and baggage all collide in a narrow operational window, a reminder that prediction alone cannot resolve behavior-driven bottlenecks.
Buses vs. Rail: Shared Crowding, Different Tools
Peak-hour crowding is a common challenge across urban rail and bus systems, with both affecting travel satisfaction and operational performance. Where rail agencies grapple with train scheduling and platform dynamics, bus operators lean on route re-allocation, load prediction from counting data, and smart-stop monitoring, comparing well across modes when the underlying passenger-flow data is strong.
Turning Data into Action: The Future of Bus Transport
The Harbin study offers a blueprint for how cities can use data to tackle passenger-crowding and create more efficient, user-friendly bus systems. By understanding passenger flow patterns, identifying crowded areas, and implementing targeted solutions, cities can transform the daily commute, reduce congestion, and promote sustainable urban mobility. The future of bus transport is data-driven, and the journey has just begun.
From Re-Allocation to Real-Time Response
The evidence points to a layered strategy: traditional fixes such as re-allocating buses from other routes address supply, while predictive models and smart infrastructure address demand. AI-powered smart bus stops help agencies manage passenger crowding through real-time monitoring, intelligent infrastructure, and smarter mobility systems, tying the operational and technological threads together.
The Next Frontier: AI and Behavior-Aware Stops
The frontier lies in AI-powered infrastructure that pairs passenger counting with behavioral analytics, such as detecting when commuters abandon a stop or leave before boarding. As these systems mature, transit agencies could shift from reacting to crowding toward anticipating it, blending live load data with pattern recognition at the stop level.
Crowding as a Network-Wide Problem
Crowding rarely lives in one stop or vehicle; it emerges from the topology of the whole network, since bus stops and routes form complex graphs with structured degree distributions. Research on bus networks across multiple cities shows that route connectivity patterns follow identifiable laws, suggesting that crowding relief must be coordinated across the network rather than patched at isolated hotspots.
People, Not Just Passengers
Behind every crowding metric is a traveler whose satisfaction drops when trains and buses are packed, with peak-hour crowding directly tied to worse ride experiences. Understanding human behavior, such as why commuters decide to leave a stop when service is too congested, is essential to making data-driven fixes feel like genuine relief rather than invisible process changes.