
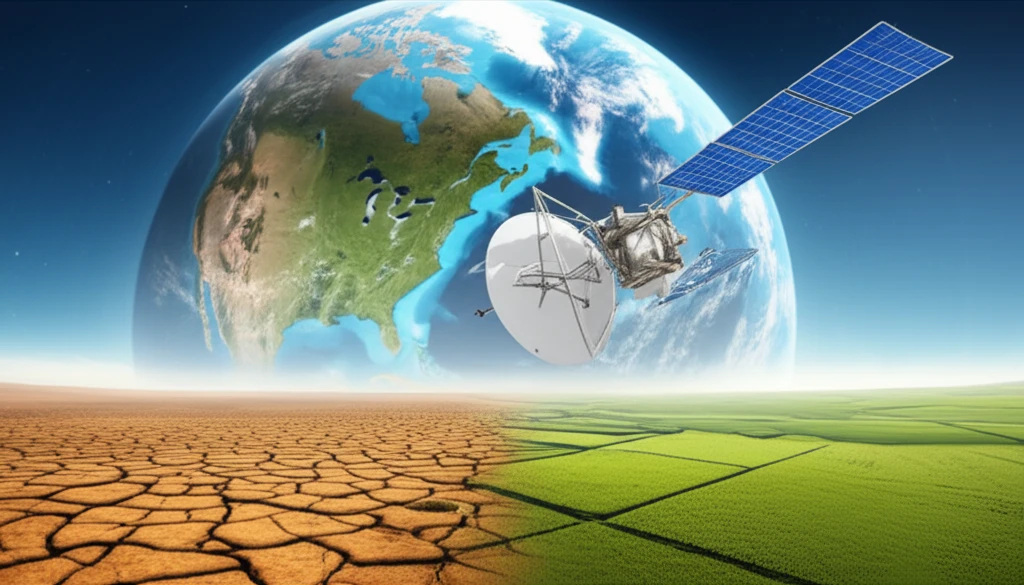
Is Your Soil Sick? How to Map Salinity Using Satellite Data

"Discover how scientists are using satellite imagery and innovative mapping techniques to combat soil salinization, ensuring healthier lands for future generations."
Imagine vast stretches of land, once fertile and productive, now rendered barren by the insidious creep of salt. This isn't a scene from a dystopian novel, but a reality for many regions around the globe. Soil salinization, the accumulation of excessive salt in the soil, poses a significant threat to agriculture, biodiversity, and overall ecosystem health. In areas like Ghannouch, Tunisia, where hypersaline soils are widespread, understanding the extent and dynamics of this phenomenon is crucial.
Traditional methods of soil assessment are often time-consuming, labor-intensive, and limited in scope. However, advances in remote sensing technology offer a powerful new tool for mapping and monitoring soil salinity over large areas. By analyzing data from satellites like the European Space Agency's Sentinel-2, scientists can identify areas affected by salinization and track changes over time. But how exactly does this work?
One innovative approach involves the use of decision tree algorithms, which combine spectral information from satellite imagery with various optical indices to create accurate land cover maps. This method allows researchers to differentiate between various types of land cover, including halophyte vegetation (plants that thrive in salty conditions), bare soil, and water bodies. By understanding the distribution of these different land cover types, we can gain valuable insights into the extent and severity of soil salinization.
Global Soil Salinity by the Numbers
Soil salinization is a major global problem, particularly in arid and semi-arid regions, threatening agriculture and land sustainability. Recent research has produced global soil salinity maps at 10-meter resolution using multi-source remote sensing data, providing detailed, high-precision baselines for soil property investigation and resource management. However, inconsistency between the 10-meter spatial resolution of remote sensing indices and the 1-kilometer resolution of other geospatial data increases uncertainty and leads to incomplete training on soil salinity content differences. Climatic conditions, groundwater, and salinity indices are identified as key covariates in global soil salinity estimation.
The Satellite Salinity Toolkit
Remote sensing has become the standard approach for mapping soil salinity at scale, offering a cost-effective and scalable alternative to conventional laboratory methods. Typical workflows rely on spectral salinity indices derived from multispectral satellite imagery, often combined with vegetation indices to improve discrimination between saline and non-saline soils. Regression models, machine learning algorithms, and increasingly deep learning architectures are applied to link these spectral signals with ground-truth salinity measurements. A persistent limitation is the trade-off between spatial resolution, temporal coverage, and acquisition cost—high-resolution sensors provide detail but may have narrow swaths or long revisit times, while broader-coverage sensors sacrifice spatial detail.
How Remote Sensing Became the Go-To for Salinity Mapping
Remote sensing has emerged as a pivotal approach for monitoring and mapping soil salinity, offering cost-effective and scalable solutions compared to conventional laboratory methods. Early applications established that spectral information from satellite platforms could detect variations in surface salinity linked to irrigation practices and groundwater quality. Spatio-temporal assessments using remote sensing data and multivariate analysis demonstrated that saline groundwater used for irrigation and aquacultural activities exacerbates soil salinization. Over time, researchers recognized that the accuracy of remote sensing-based salinity mapping depends on how effectively spectral information is integrated with advanced modeling approaches. Fundamental trade-offs between data resolution, spatial and temporal coverage, acquisition costs, and accuracy expectations have constrained practical applications throughout this evolution.
Mapping Salinity: How Does the Decision Tree Algorithm Work?
The decision tree algorithm is a sophisticated method that uses a series of criteria to classify different land cover types based on their spectral characteristics. Here’s a step-by-step breakdown of how it works:
- NDWI (Normalized Difference Water Index): Uses green and near-infrared bands to detect water bodies, effectively excluding soil and vegetation.
- NDVI (Normalized Difference Vegetation Index): Measures vegetation intensity using red and near-infrared bands. Higher values indicate denser green vegetation.
- Salinity Indices (SIs): Utilize combinations of blue, green, red, and near-infrared bands to react to salty soil, especially where vegetation is sparse.
Remote Sensing and GIS: A Comprehensive Review
A comprehensive review of remote sensing and GIS-based methods for soil salinity estimation covers salinity indices, vegetation indices, regression methods, and neural network approaches. The latest advancements in remote sensing and GIS-based techniques for soil salinization assessment highlight key spectral indices, mapping approaches, and spatial modeling techniques. These reviews consolidate a growing body of literature demonstrating that integrating multiple data sources and advanced algorithms improves salinity prediction accuracy compared to single-index methods.
Where Satellite Methods Fall Short
Despite growing enthusiasm, remote sensing-based soil salinity mapping faces significant unresolved challenges. The heterogeneity of soil surfaces, confounding effects of soil moisture and vegetation cover, and limited ground-truth calibration data all introduce substantial uncertainty into satellite-derived estimates. Many published studies rely on localized datasets and single-sensor approaches, making it difficult to generalize findings across diverse climatic and geological settings. Additionally, the assumption that spectral reflectance alone can reliably distinguish salt-affected soils from other land surface conditions remains contested, particularly in mixed-pixel environments at coarse spatial resolutions.
Multi-Source Data Fusion for Salinity Monitoring
Optimization of multi-source remote sensing for soil salinity monitoring has emerged as a key strategy for improving accuracy in arid and semi-arid regions. Due to the spatiotemporal heterogeneity of soil properties and environmental conditions, single-sensor or single-date approaches often yield inconsistent results. Studies combining optical, radar, and thermal data sources alongside ancillary variables such as climate and topography report improved model performance compared to single-source methods. However, the challenge of harmonizing disparate data resolutions and formats persists, requiring careful preprocessing and integration frameworks to realize the full potential of multi-source fusion.
Why Does This Matter?
This research offers a powerful tool for understanding and addressing soil salinization. By using satellite data and decision tree algorithms, we can create detailed maps of affected areas, monitor changes over time, and develop targeted strategies for mitigating the problem. This approach has the potential to improve agricultural practices, protect biodiversity, and ensure the long-term health of our ecosystems.
Putting the Pieces Together
The remote sensing community has made substantial progress in mapping soil salinity from space, with current research converging on multi-source, multi-temporal approaches that integrate spectral indices with machine learning. High-resolution global soil salinity maps at 10-meter resolution now provide actionable baselines for land management, yet uncertainty persists due to spatial resolution mismatches between remote sensing products and ancillary geospatial datasets. Experts caution that no single methodology or sensor can universally solve the salinity mapping problem; instead, context-specific calibration and validation remain essential. The field is moving toward standardized protocols and open data platforms to enable more reproducible and scalable assessments.
Scaling Up: The Road Ahead
Large-scale soil salinity estimation based on remote sensing tools remains a significant challenge, primarily due to data resolution limitations and acquisition costs. Future progress will likely depend on advances in satellite constellations offering higher spatial and temporal resolution at lower cost, as well as improved cloud computing infrastructure for processing massive datasets. Integration of emerging data sources—such as hyperspectral imagery and synthetic aperture radar—promises to enhance detection capabilities, particularly in cloud-prone and wet regions where optical sensors struggle. Ultimately, bridging the gap between local calibration studies and global operational monitoring systems will require sustained investment in ground-truth networks and international data-sharing agreements.
Beyond the Satellite Image
Soil salinity mapping from space does not exist in a vacuum—it intersects with water management policy, irrigation infrastructure, climate adaptation strategies, and agricultural economics. Remote sensing provides detection and monitoring, but translating satellite-derived salinity maps into on-the-ground remediation requires coordination among farmers, water managers, and policymakers. Data resolution and cost barriers limit who can access and benefit from these technologies, potentially widening gaps between well-resourced and resource-poor agricultural regions. Systemic challenges including fragmented data governance, lack of standardized salinity classification schemes, and insufficient long-term monitoring programs remain significant hurdles to operationalizing satellite-based salinity management at scale.
Salinity on the Ground: What It Means for Farmers
Soil salinity is considered one of the biggest constraints to crop production, particularly in arid and semi-arid regions affected by recurrent and long periods of drought, where high salinity levels severely impact plant stress and agricultural output. Longitudinal analyses using remote sensing imagery and machine learning algorithms have revealed how salinity levels fluctuate in salt-affected crop fields over time, providing actionable insights for farm management. Climate change accelerates soil salinization through factors such as altered precipitation patterns, rising water tables, and land use/land cover changes, compounding existing pressures on vulnerable farming communities. These findings underscore that satellite-based salinity monitoring is not merely an academic exercise but a practical tool for supporting food security in regions where livelihoods depend on productive soils.