Interconnected global network of economic relationships.

Decoding Global Economies: What Network Analysis Reveals About the World's Financial Interconnections

"Uncover the hidden relationships between developed countries and learn how economic analysis can forecast future stability and growth."


In an increasingly interconnected world, understanding the relationships between different economies is more critical than ever. Traditional economic analysis often focuses on individual nations, but this approach overlooks the complex web of interactions that shape the global financial landscape. Network analysis offers a powerful tool for mapping and interpreting these relationships, providing insights that can't be gleaned from studying isolated economies.

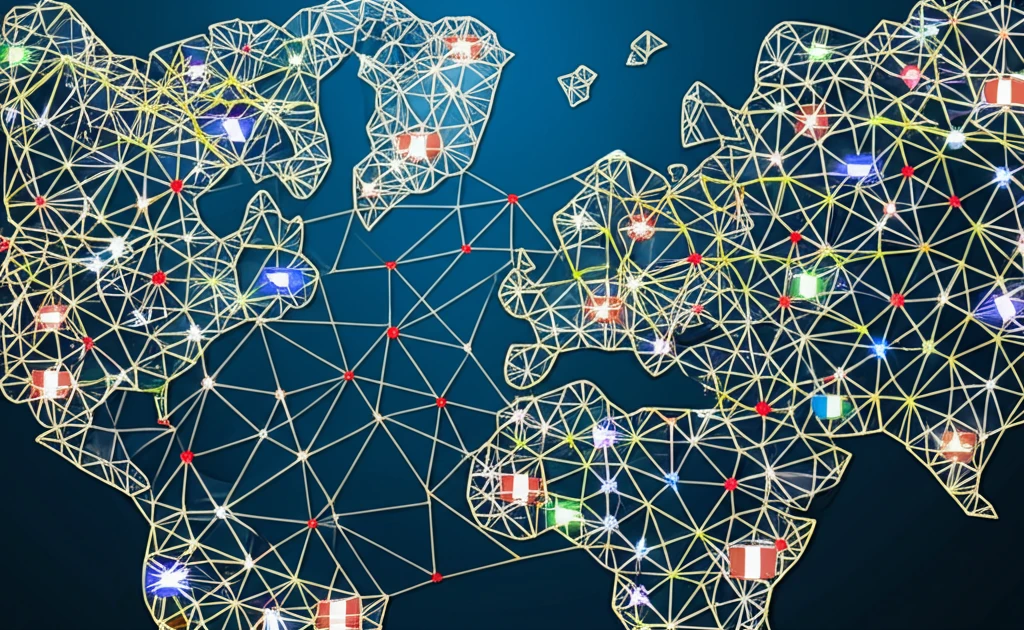
Imagine the global economy as a vast network, where each country is a node and the connections between them represent the strength of their economic ties. These ties can be measured by various factors, such as trade, investment, and financial flows. By analyzing the structure of this network, we can identify key players, detect emerging trends, and even predict potential crises.

This article delves into a fascinating study that applies network analysis to examine the correlations between the economies of the world's most developed countries. By using innovative algorithms to assess the strength and stability of these connections, the study uncovers surprising patterns and reveals the hidden dynamics that drive the global economy. Join us as we break down these complex concepts and explore the practical implications of this groundbreaking research.

Correlation Strength: The Key to Unlocking Economic Relationships

Interconnected global network of economic relationships.

At the heart of network analysis lies the concept of correlation strength. This measures how closely the economic performance of two countries is linked. A strong positive correlation suggests that their economies tend to move in the same direction, while a negative correlation indicates that they move in opposite directions. By analyzing these correlations, we can gain valuable insights into how different economies influence each other.

The study uses a novel approach called the Power Law Classification Scheme (PLCS) to assess correlation strength. This method involves analyzing the Manhattan Distance (MD) between the Gross Domestic Product (GDP) per capita time series of different countries. The MD measures the cumulative difference between two time series, providing a robust way to capture both linear and non-linear relationships.

Here’s a simplified breakdown of the PLCS algorithm:
  • Transform GDP data into cumulative Manhattan Distance time series.
  • Plot the cumulative MD as a function of time in logarithmic scale.
  • Fit a linear function to the data and extract the slope coefficient.
  • Classify the correlation strength based on the slope coefficient.
  • Evaluate the statistical significance of the fit to assess the stability of the correlation.
This method helps categorize relationships beyond simple positive or negative correlations. It identifies converging economies (where MD decreases), diverging economies (where MD increases), and linearly correlated economies. Understanding these nuances provides a richer picture of global economic interactions.

Implications for Investors, Policymakers, and Everyday Citizens

The insights derived from economic network analysis have far-reaching implications. For investors, understanding correlation strengths can help diversify portfolios and identify potential risks and opportunities. Policymakers can use this information to design more effective economic policies and anticipate the impact of global events. Even everyday citizens can benefit from a deeper understanding of the forces that shape the global economy, allowing them to make more informed decisions about their finances and future.

About this Article -

This article was crafted using a human-AI hybrid and collaborative approach. AI assisted our team with initial drafting, research insights, identifying key questions, and image generation. Our human editors guided topic selection, defined the angle, structured the content, ensured factual accuracy and relevance, refined the tone, and conducted thorough editing to deliver helpful, high-quality information.See our About page for more information.

Everything You Need To Know

1

What does economic network analysis reveal about global financial interconnections that traditional methods might miss?

Economic network analysis uncovers the hidden relationships and interdependencies between different economies, treating the global economy as a vast network where countries are nodes and their economic ties are the connections. By analyzing the strength and stability of these connections, measured through trade, investment, and financial flows, network analysis identifies key players, detects emerging trends, and predicts potential crises. This approach goes beyond traditional analysis, which often focuses on individual nations in isolation, overlooking the complex interactions that shape the global financial landscape.

2

How is 'correlation strength' used in network analysis, and what does it tell us about the relationship between different economies?

Correlation strength measures how closely the economic performance of two countries is linked. A strong positive correlation suggests their economies tend to move in the same direction, while a negative correlation indicates they move in opposite directions. Analyzing these correlations provides insights into how different economies influence each other within the global network, helping to identify potential risks and opportunities. The Power Law Classification Scheme (PLCS) is used to assess correlation strength.

3

Can you explain the Power Law Classification Scheme (PLCS) used to determine correlation strength in more detail?

The Power Law Classification Scheme (PLCS) is a method used to assess correlation strength between economies. It involves analyzing the Manhattan Distance (MD) between the Gross Domestic Product (GDP) per capita time series of different countries. The PLCS algorithm transforms GDP data into cumulative Manhattan Distance time series, plots the cumulative MD as a function of time in logarithmic scale, fits a linear function to the data, extracts the slope coefficient and then classifies the correlation strength based on the slope coefficient. It then evaluates the statistical significance of the fit to assess the stability of the correlation. This method identifies converging, diverging, and linearly correlated economies.

4

How does the Manhattan Distance (MD) help in understanding the relationships between economies, and why is it useful?

The Manhattan Distance (MD) measures the cumulative difference between the Gross Domestic Product (GDP) per capita time series of different countries. It is useful because it captures both linear and non-linear relationships, providing a robust way to assess how economies are moving relative to each other over time. By analyzing the MD, network analysis can determine whether economies are converging (MD decreases), diverging (MD increases), or maintaining a linear correlation. The MD is a component of the Power Law Classification Scheme (PLCS).

5

What are the practical implications of economic network analysis for investors, policymakers, and everyday citizens, especially concerning risk management and financial stability?

For investors, understanding correlation strengths derived from economic network analysis can aid in diversifying portfolios and identifying potential risks and opportunities. Policymakers can use this information to design more effective economic policies and anticipate the impact of global events, helping to stabilize markets. Even everyday citizens can benefit by gaining a deeper understanding of the forces that shape the global economy, allowing them to make more informed decisions about their finances and future financial planning. For example, the Power Law Classification Scheme (PLCS) allows them to see how closely their GDP correlates to other economies.

Newsletter Subscribe

Subscribe to get the latest articles and insights directly in your inbox.