
Mystum Business & Economy Category Page List All Articles

Business & Economy

Data transforming into a flourishing tree

Unlocking Job Training's Long-Term Secrets: How Data Can Guide Us

Explore how combining experimental and observational data provides a clearer picture of the long-term effectiveness of job training programs. Learn about new methods for better understanding job training programs.
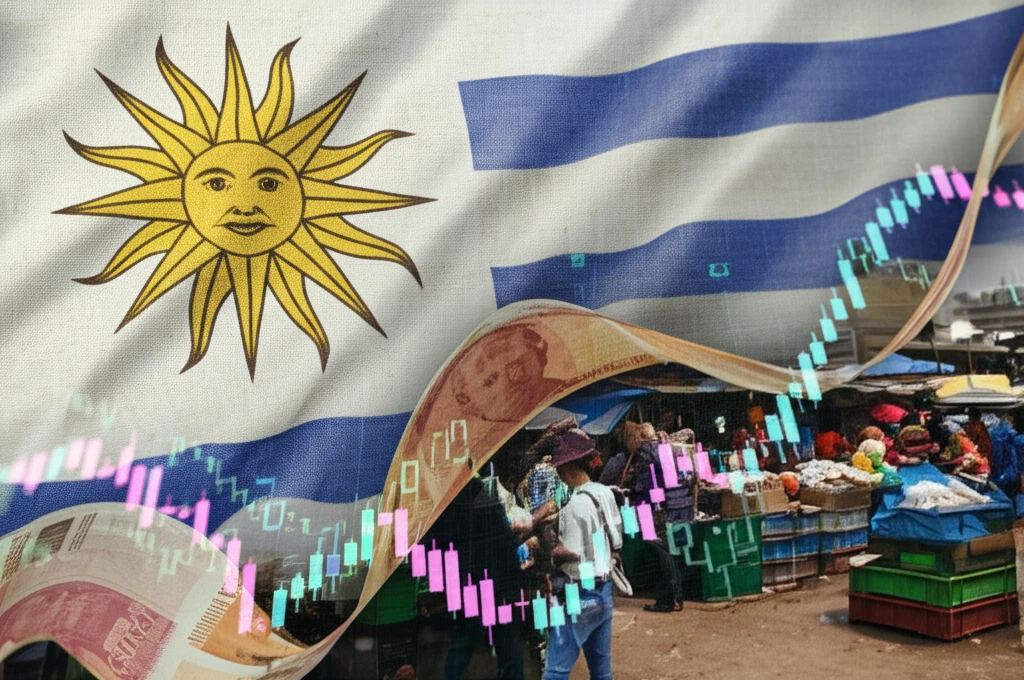

Uruguayan currency flowing into a market, symbolizing economic exchange.

Decoding Uruguay's Economy: What the Exchange Rate Reveals About Your Finances

Explore the key factors influencing Uruguay's exchange rate and what they mean for your money. This guide breaks down complex economic concepts into actionable insights.

Distorted financial chart with a prominent outlier.

Is Your Data Lying to You? How to Build Trustworthy Economic Models

In an era of data-driven decision-making, economic models are only as reliable as the data they use. Learn how to protect your analyses from being skewed by outliers and statistical noise, leading to more accurate and robust results.

Close-up of a paycheck with gears and clockwork.

Minimum Wage: The Devil's in the Details – How German Policies Impact Your Paycheck

Dive into the intricacies of Germany's minimum wage policy and its unexpected effects on working hours, minijobs, and wage inequality. Learn how institutional frameworks shape your paycheck.

Intertwined gears representing data sharing between competing businesses.

Data Sharing Dilemma: Can Competitors Collaborate for Mutual Gain?

Explore the complexities of data sharing among competing firms, uncovering how strategic collaboration can lead to mutual benefits, enhanced predictions, and new competitive strategies.

Interconnected global economies with spillover effects

Beyond Traditional Methods: How to Get a More Accurate View of Economic Trends

Frustrated with standard economic analysis? Learn how the Inclusive Synthetic Control Method (iSCM) can refine your understanding of economic impacts by accounting for spillover effects and treated units within donor pools.

Stylized economic chart overlaid with translucent statistical distributions.

Decoding Data: How Order Statistics Can Improve Economic Measurement

Learn how economists are using order statistics and deconvolution techniques to improve the accuracy of economic measurements, addressing issues like measurement errors and data truncation for better insights.

A parched field in India under a stormy sky represents the challenges and resilience in agriculture.

Is Your Farm Ready for the Future? Unveiling the Truth About Weather Insurance in India

Navigate the complexities of agricultural production in India with insights on weather index insurance, its hidden costs, and smarter strategies for future-proofing your farm against climate change.

Sailboat navigating through stormy seas, symbolizing market volatility.

Decoding Stock Market Volatility: What Causes the Swings and How to Navigate Them

Uncover the dynamics behind stock market fluctuations. Learn how market connectivity, risk spillover, and investor behavior influence volatility, and get practical tips for navigating turbulent times.

A network of interconnected nodes symbolizing stock market contagion.

Is Your Portfolio Safe? How to Navigate Stock Market Contagion Risks

Learn how stock market contagion works, which stocks are most vulnerable, and how to protect your investments in turbulent times. Discover the power of network analysis and minimum information entropy.

Page 93 of 247

Newsletter Subscribe

Subscribe to get the latest articles and insights directly in your inbox.