Interconnected nodes forming a network, representing infection spread.

The Reproduction Number: Why It's Not What You Think (and What Actually Matters)

"New research reveals the classic epidemiological concept of the reproduction number (R0) falls short in real-world scenarios. Discover why contact networks matter more than you thought."


For decades, the basic reproduction number (R0) has been a cornerstone of epidemiology. It's the go-to metric for understanding how quickly a disease might spread, informing public health strategies and shaping our understanding of outbreaks. The concept is simple: R0 represents the average number of new infections caused by a single infected individual in a completely susceptible population.

However, recent research is shaking up this long-held belief. A new study, published in PNAS, suggests that R0, as classically defined, may not be as reliable as we once thought, particularly when applied to real-world scenarios with complex social structures. The researchers argue that the intricacies of human contact patterns significantly impact disease transmission in ways that R0 doesn't fully capture.

This article dives into the key findings of this research, exploring why the classical concept of R0 may be insufficient, and highlighting alternative approaches to better understand and predict epidemic dynamics. We'll uncover how detailed data on social contacts, combined with advanced modeling, is changing the way we think about disease spread.

The Problem with R0: It's Too Simplistic

Interconnected nodes forming a network, representing infection spread.

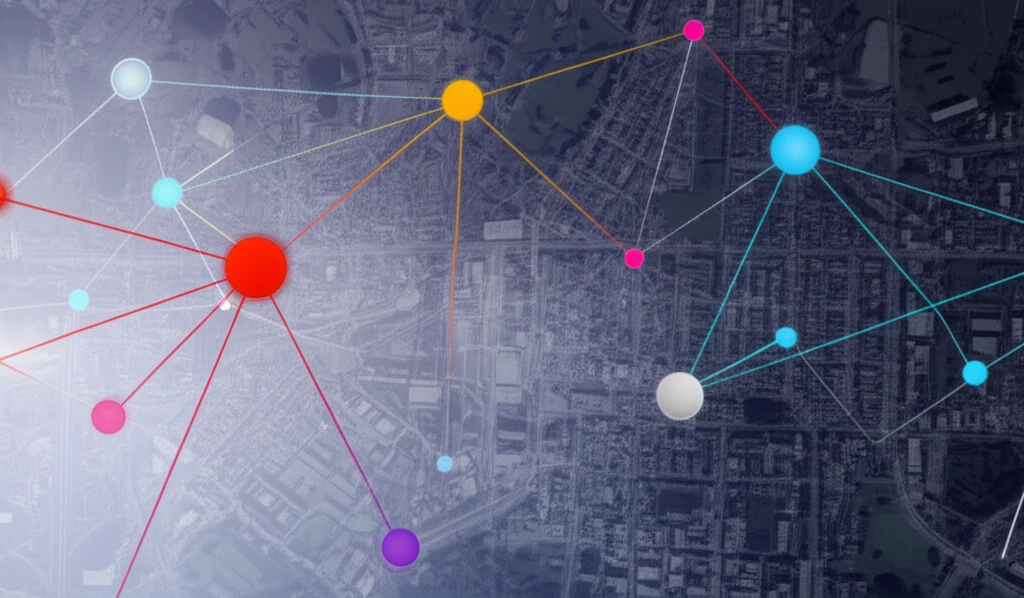
The traditional definition of R0 works well in homogenous models, where everyone has roughly the same number of contacts and the population is uniformly susceptible. But real life isn't that simple. People live in households, attend schools or workplaces, and have varying degrees of social interaction. These complex contact networks create clusters of interactions that significantly influence how a disease spreads.

To investigate this, researchers created detailed models of the Italian and Dutch populations, using real-world sociodemographic data to simulate how influenza would spread through these communities. Unlike simpler models, these simulations accounted for the different layers of contact: households, schools, workplaces, and general community interactions. By tracking individual-level transmission events, they were able to directly measure the reproduction number and generation time (the time between primary and secondary infections).

  • The classical definition doesn't capture real-world complexity: R0 assumes a homogenous population, which rarely exists.
  • Contact networks matter: The study highlights the crucial role of clustered contacts (households, schools, workplaces) in shaping epidemic dynamics.
  • Individual variation is key: People have different social circles and behaviors, impacting their likelihood of infection and transmission.
The results were striking. The researchers found that the effective reproduction number, R(t) – the average number of secondary cases at a specific time – varied significantly over the course of the epidemic. It increased in the early phase, peaked, and then declined, a pattern not predicted by the classical R0, which assumes a steady exponential growth phase. This deviation suggests that the static R0 value fails to capture the dynamic nature of disease transmission in realistic populations.

R(t): A More Realistic View

So, if R0 isn't the answer, what is? The study suggests focusing on the instantaneous reproduction number, R(t), which provides a more dynamic and accurate picture of transmission dynamics. By tracking how the number of secondary infections changes over time, R(t) can capture the impact of interventions, behavioral changes, and the natural progression of the epidemic.

The researchers found that methodologies aimed at estimating R(t) from incidence data can be used to characterize the correct epidemic dynamics. However, accurate estimation of R(t) depends on having reliable data on the generation time and a consistent time series of cases, free from significant noise or underreporting.

While R0 might remain a useful concept in simple models, this research underscores the importance of moving beyond static metrics and embracing more sophisticated approaches that account for the complexities of human contact patterns. Understanding these nuances is crucial for developing effective strategies to prevent and control future epidemics.

About this Article -

This article was crafted using a human-AI hybrid and collaborative approach. AI assisted our team with initial drafting, research insights, identifying key questions, and image generation. Our human editors guided topic selection, defined the angle, structured the content, ensured factual accuracy and relevance, refined the tone, and conducted thorough editing to deliver helpful, high-quality information.See our About page for more information.

This article is based on research published under:

DOI-LINK: 10.1073/pnas.1811115115, Alternate LINK

Title: Measurability Of The Epidemic Reproduction Number In Data-Driven Contact Networks

Subject: Multidisciplinary

Journal: Proceedings of the National Academy of Sciences

Publisher: Proceedings of the National Academy of Sciences

Authors: Quan-Hui Liu, Marco Ajelli, Alberto Aleta, Stefano Merler, Yamir Moreno, Alessandro Vespignani

Published: 2018-11-21

Everything You Need To Know

1

What is the basic reproduction number (R0), and what are its limitations?

The basic reproduction number (R0) is a cornerstone in epidemiology that estimates how quickly a disease spreads. It represents the average number of new infections caused by a single infected individual in a completely susceptible population. However, the classical definition of R0 is considered too simplistic because it assumes a homogenous population and fails to account for complex social structures.

2

What are complex contact networks, and why are they important?

Complex contact networks refer to the intricate patterns of social interactions, like households, schools, and workplaces. They greatly influence how a disease spreads. These networks create clusters of interactions that the basic reproduction number (R0) often fails to capture. The study accounted for different layers of contact in models of the Italian and Dutch populations, highlighting how these networks are key in understanding epidemic dynamics and disease transmission.

3

How is the effective reproduction number, R(t), different from the basic reproduction number (R0)?

The effective reproduction number, R(t), is the average number of secondary cases at a specific time. Unlike the basic reproduction number (R0), R(t) provides a more dynamic and accurate picture of transmission dynamics. It can capture the impact of interventions, behavioral changes, and the natural progression of the epidemic, providing a more realistic view of disease spread. This allows for a more nuanced understanding of the epidemic's evolution.

4

What are the implications of relying on the basic reproduction number (R0) for understanding disease spread?

The implications of using the basic reproduction number (R0) are significant because it can misinform public health strategies and shape an inaccurate understanding of outbreaks. Relying solely on R0 can lead to an underestimation or overestimation of the disease's spread, as it doesn't account for real-world complexities like social structures. This can impact the effectiveness of interventions. Thus the static R0 value fails to capture the dynamic nature of disease transmission in realistic populations.

5

What are some alternative approaches to understanding disease spread that go beyond the basic reproduction number (R0)?

Alternative approaches involve focusing on the instantaneous reproduction number, R(t), and incorporating detailed data on social contacts. The study used detailed models of the Italian and Dutch populations, using real-world sociodemographic data. By tracking how the number of secondary infections changes over time, R(t) can capture the impact of interventions, behavioral changes, and the natural progression of the epidemic. This shift towards more dynamic models and a better understanding of contact networks is changing how we think about disease spread.

Newsletter Subscribe

Subscribe to get the latest articles and insights directly in your inbox.