Map of Iraq highlighting malnutrition and income disparities.

Iraq's Hidden Crisis: Mapping Malnutrition and Poverty Hotspots

"Discover how spatial analysis reveals the unequal distribution of acute malnutrition and household income, pinpointing areas most in need of targeted interventions."


For years, Iraq has faced significant disparities in health and economic well-being across its governorates. While national-level data provides a broad overview, it often masks critical local variations. A 2004 study published in the International Journal of Statistics and Probability sought to address this gap by investigating the spatial patterns of acute malnutrition (AM) and household income (HI) in Iraq.

Historically, certain governorates have suffered disproportionately due to factors like centralized government investment in specific urban centers (Baghdad, Basra, and Nineveh) and geographic proximity to conflict zones. This raises a crucial question: Are there spatial patterns to AM and HI in Iraq, and if so, can the pattern of income explain the pattern of malnutrition? This study uses advanced mapping and statistical techniques to uncover these hidden relationships.

By using spatial analysis, the research provides a more nuanced understanding of the problem. It identifies specific geographic clusters where malnutrition is most prevalent and examines the correlation with household income levels. This approach moves beyond broad generalizations, offering policymakers a powerful tool for creating targeted interventions and allocating resources where they are needed most.

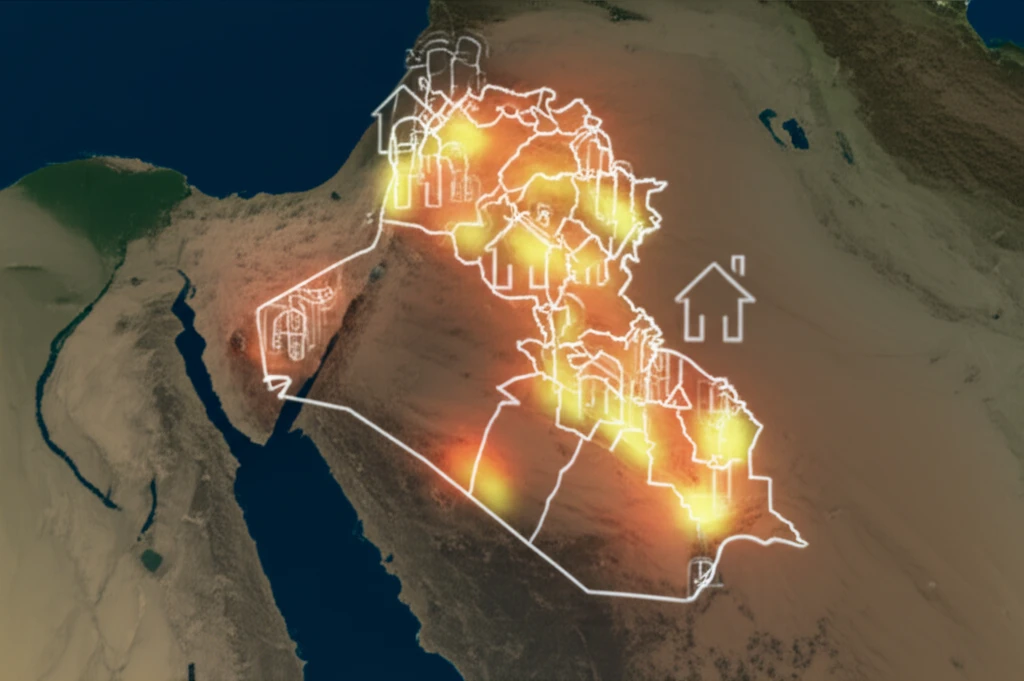
Unveiling Iraq's Malnutrition Hotspots: A Spatial Analysis

Map of Iraq highlighting malnutrition and income disparities.

The study, led by Faisal G. Khamis and Ghaleb A. El-Refae, used cross-sectional survey data collected in 2004, covering 18 governorates in Iraq. The researchers employed a multi-stage approach, beginning with mapping AM and HI using quartiles to visually identify potential disparities. Then, they applied spatial econometric techniques, including Global and Local Moran's I statistics, to quantify the spatial autocorrelation – the degree to which values at one location are similar to nearby locations.

Global Moran’s I provides an overall measure of clustering, indicating whether high or low values of AM and HI tend to group together across the entire study area. Local Moran’s I identifies specific clusters of high or low values within individual governorates. Finally, Wartenberg’s measure was used to assess the bivariate spatial correlation between AM and HI, revealing whether these two variables tend to be related geographically.

  • Mapping: Visual representation of AM and HI levels across governorates using different shades to indicate quartiles.
  • Global Moran's I: A statistical measure to determine if there is overall clustering of high or low values for AM and HI.
  • Local Moran's I: Identifies specific geographic clusters (hotspots) of high or low AM and HI within individual governorates.
  • Wartenberg's Measure: Assesses the spatial correlation between AM and HI, indicating if they tend to be geographically associated.
The results revealed a troubling pattern: high levels of AM generally clustered in the western-southern governorates. This clustering was confirmed by a statistically significant Global Moran's I statistic for AM. Conversely, low levels of HI tended to concentrate in northern and western-southern governorates, although this clustering was not statistically significant at the global level. When examining local clusters, the study identified three governorates as significant hotspots for AM and one for HI. However, the bivariate spatial correlation between AM and HI was not found to be significant, suggesting a more complex relationship than a simple direct correlation.

Turning Data into Action: A Path Towards Equitable Health in Iraq

This study underscores the critical need for targeted interventions to address acute malnutrition in Iraq. By identifying specific geographic clusters, policymakers can move beyond generalized approaches and allocate resources more effectively. This means tailoring interventions to the unique needs and circumstances of each region, considering not only household income but also other socio-economic and environmental factors that may contribute to malnutrition.

While the study did not find a direct spatial correlation between AM and HI, this does not negate the importance of poverty reduction strategies. Instead, it suggests that the relationship is more complex and mediated by other variables. Future research should explore these mediating factors, such as access to clean water, sanitation, healthcare, and education, to develop more comprehensive interventions.

Ultimately, addressing malnutrition requires a multi-faceted approach that combines targeted interventions with broader efforts to improve socio-economic conditions and strengthen healthcare systems. By using spatial analysis to inform policy decisions, Iraq can move towards a more equitable distribution of health and well-being for all its citizens. Regular monitoring and updated studies are also essential to track progress and adapt strategies to changing conditions.

About this Article -

This article was crafted using a human-AI hybrid and collaborative approach. AI assisted our team with initial drafting, research insights, identifying key questions, and image generation. Our human editors guided topic selection, defined the angle, structured the content, ensured factual accuracy and relevance, refined the tone, and conducted thorough editing to deliver helpful, high-quality information.See our About page for more information.

This article is based on research published under:

DOI-LINK: 10.5539/ijsp.v1n1p43, Alternate LINK

Title: Association Between Spatial Patterns Of Acute Malnutrition And Household Income In Iraq-2004

Subject: General Medicine

Journal: International Journal of Statistics and Probability

Publisher: Canadian Center of Science and Education

Authors: Faisal G. Khamis, Ghaleb A. El-Refae

Published: 2012-04-26

Everything You Need To Know

1

What do acute malnutrition and household income represent, and why are they important?

Acute malnutrition (AM) refers to a condition where individuals, particularly children, suffer from a sudden and severe lack of essential nutrients, leading to significant health risks. Household income (HI) represents the financial resources available to a family, influencing their ability to access food, healthcare, and other necessities. Both AM and HI are crucial indicators of a population's health and well-being. The mapping of these factors, especially in regions like Iraq, helps understand the complex interplay of socioeconomic and health-related challenges faced by different communities.

2

Why is spatial analysis important in understanding malnutrition and poverty?

Spatial analysis is important because it unveils hidden geographic patterns and relationships within data. It goes beyond simple averages or national figures by examining how variables like acute malnutrition (AM) and household income (HI) are distributed across specific locations. Identifying clusters or 'hotspots' of high AM or low HI allows policymakers to focus interventions where they're most needed. This targeted approach is far more effective than blanket programs, ensuring resources reach the most vulnerable populations. The application of spatial econometric techniques, including Global and Local Moran's I statistics, as well as Wartenberg’s measure, adds rigor and precision to this approach.

3

How did the researchers analyze the data to identify patterns of malnutrition and poverty?

The study, using a multi-stage approach, first mapped Acute Malnutrition (AM) and Household Income (HI) using quartiles to visualize potential disparities across the 18 governorates. Then, Global and Local Moran's I statistics were applied. Global Moran's I determined if overall clustering of high or low values for AM and HI existed. Local Moran's I identified specific geographic clusters (hotspots) of high or low AM and HI within individual governorates. Finally, Wartenberg's measure was used to assess the bivariate spatial correlation between AM and HI. This allowed for a nuanced understanding of the complex relationships between AM, HI, and their geographic distribution within Iraq.

4

What were the key findings regarding the spatial distribution of acute malnutrition and household income?

The findings revealed that high levels of acute malnutrition (AM) tended to cluster in western-southern governorates. This was supported by a significant Global Moran's I statistic for AM. Conversely, low levels of household income (HI) were often found in the northern and western-southern governorates, although the clustering wasn't statistically significant at the global level. Local Moran's I analysis identified specific hotspots for AM and HI within individual governorates. However, the study showed that the relationship between AM and HI wasn't a simple, direct correlation. This suggests that factors beyond income play a role in malnutrition.

5

What are the implications of these findings for addressing malnutrition in Iraq?

The implications of the study are significant. It underscores the need for targeted interventions. By identifying specific geographic clusters of acute malnutrition (AM), policymakers can move beyond generalized strategies. This approach allows for more effective allocation of resources, tailoring interventions to the unique needs of each region. This also means considering factors beyond household income (HI), like environmental conditions or specific socio-economic challenges. By understanding the spatial patterns of AM and HI, interventions can be designed to address the root causes of malnutrition and poverty, ultimately contributing to improved health and well-being for all Iraqis.

Newsletter Subscribe

Subscribe to get the latest articles and insights directly in your inbox.