Decoding Pesticides: How to Protect Your Health and the Environment
"A Comprehensive Guide to Understanding Pesticide Use Reporting (PUR) Data and Its Impact on Your Community"
Have you ever wondered about the chemicals being used on the crops around you, or how they might affect your water supply? Pesticides play a significant role in modern agriculture, but their use raises important questions about environmental and human health. Understanding the details of pesticide application is crucial for making informed decisions and advocating for responsible practices.
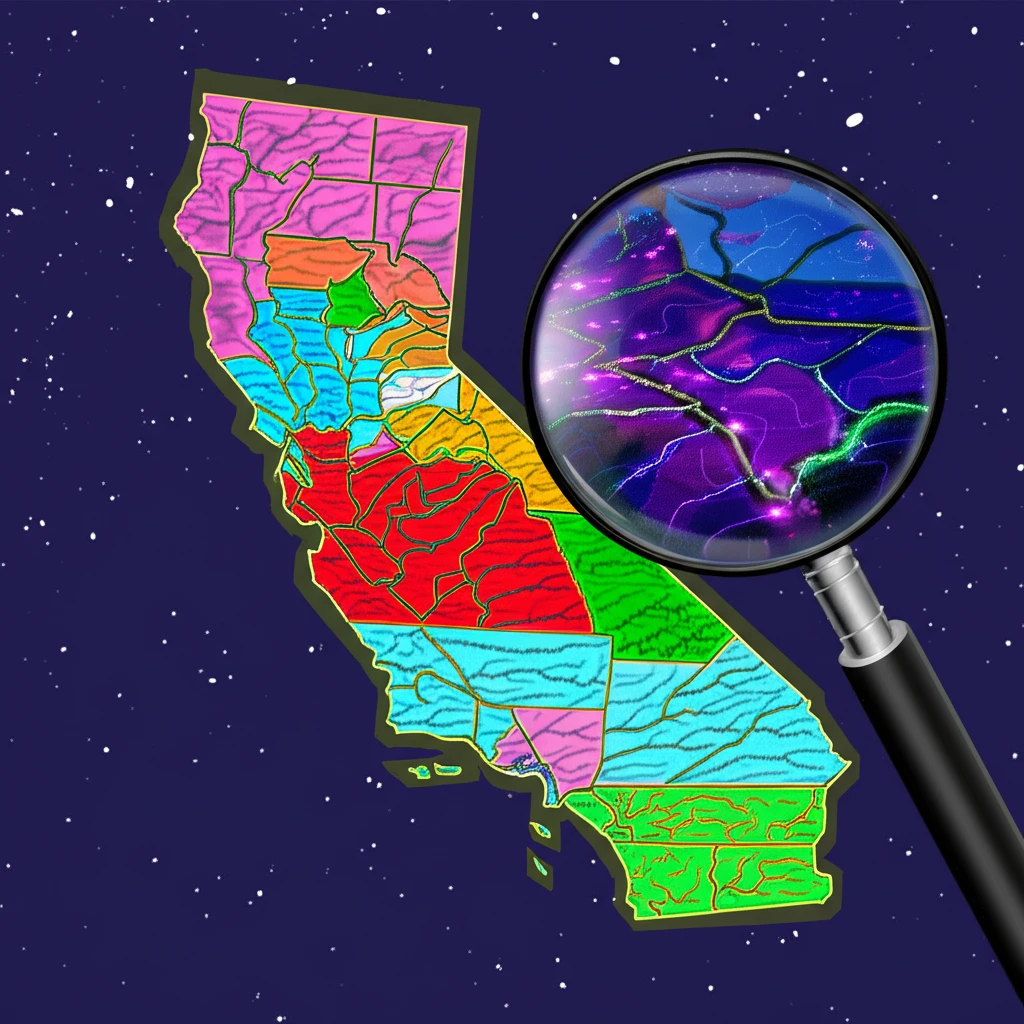
California, a major agricultural hub, has implemented a comprehensive system for tracking pesticide use. The California Department of Pesticide Regulation (CDPR) collects detailed information on every pesticide application across the state. This data, known as Pesticide Use Reporting (PUR) data, offers a wealth of insights into the types, quantities, and locations of pesticides being used. However, accessing and interpreting this data can be challenging.
This guide will walk you through the complexities of PUR data, explain how to access it, and provide practical tips for understanding its implications. We'll explore how tools like PURwebGIS are making this information more accessible and empowering individuals and communities to take action.
Unlocking the Power of PUR Data
The CDPR's PUR database is a unique resource, providing details on pesticide applications down to the level of individual fields. Since 1990, California has maintained this detailed record, capturing information about what pesticides are used, where they are applied, and when. This level of detail is invaluable for researchers, policymakers, and concerned citizens alike.
- Chemicals used
- Crops treated
- Application method (aerial, ground, etc.)
- Location identifiers
Empowering Informed Action
Understanding pesticide use is a critical step towards protecting our health and the environment. By leveraging the power of PUR data and tools like PURwebGIS, we can gain valuable insights, advocate for responsible practices, and create healthier communities for ourselves and future generations. Explore the resources mentioned in this guide, and become an informed advocate for a more sustainable future.